Blackfire profiler on fortrabbit
tldr; We are excited to announce the availability of the Blackfire profiler on fortrabbit.
Prologue
We get a lot of sales pitches, recruitment offerings and partnership requests. We usually kindly ignore all of it. So we did with an email from Olivier Creiche — actually his company SensioLabs should have ringed a bell. Anyways, he gave us a call and we quickly arranged a skype call with Fabien Potencier who himself! gave us a demo of the new Blackfire profiler. With technical guidance form Nicolas Grekas we tested the Blackfire setup in our test environment and finally soft-launched it last friday in production.
Why profiling anyways?
Today’s web applications can quickly become complex under the hood. Thanks to Composer we can rely on existing packages without reinventing the wheel. Especially frameworks, CMS and e-commerce systems give you a lot of boilerplate and convenience for your development process. But this also means you hardly can understand every single bit of code you are using.
Web applications are usually fast after the launch, but degrade over time. They receive more requests and process more data. You add more features and at some point everything or some parts of your app become slow. But where to start investigating — guessing and trial and error? Profilers to the rescue! They give you deep insights of your code and all dependencies that are involved to handle requests.
Blackfire vs. other profiling tools

The XDEBUG profiler and XHPROF are around for a while and known in the PHP world and are the defacto open source standard. They collect a bunch of data for every single function call in the request-to-response lifecycle. Tools like KCacheGrind, MacCallGrind, Webgrind for XDEBUG and xhgui, uprofiler for XHPROF help to analyse and visualize this data. If you ever tried one of these you know that all these metrics, such as wall (elapsed) time, CPU time and memory usage, can be overwhelming.
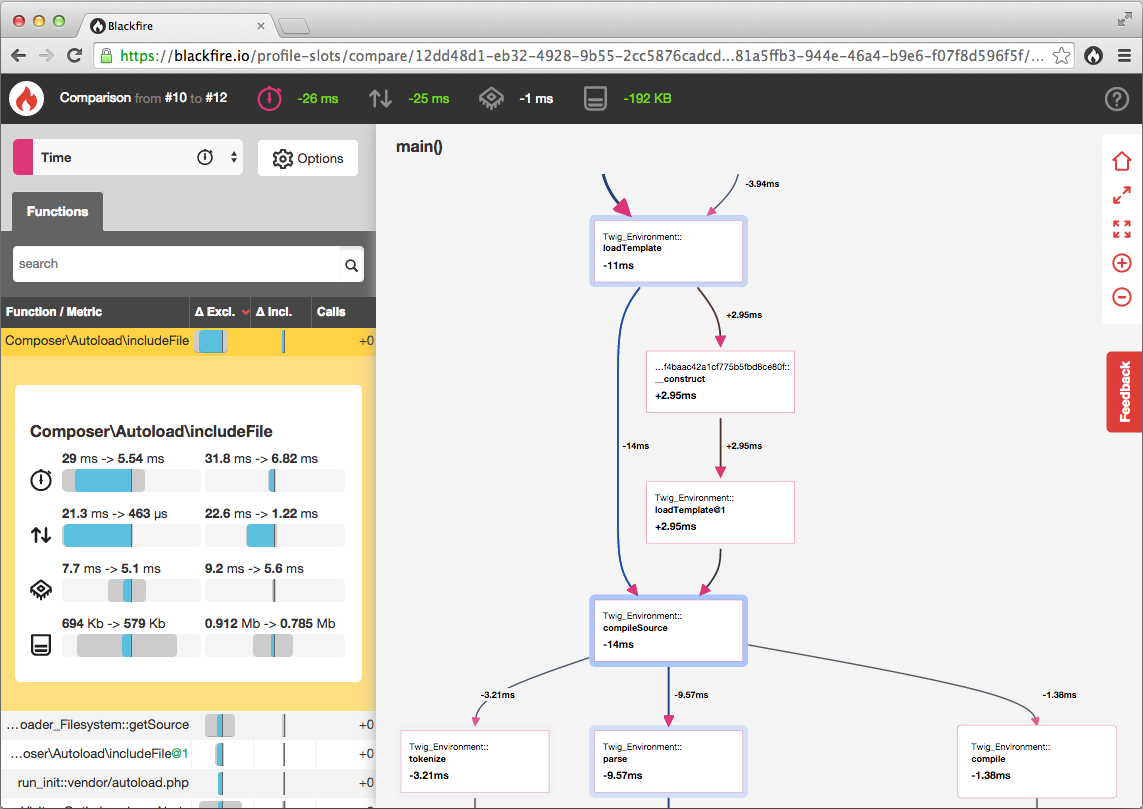
My first impression of Blackfire was a similar one, a call graph, tables with data. But it took me not long to get into it and understand the differences. The GUI is actually pretty neat and helps you to distinguish relevant from irrelevant data. You can create multiple slots to store your results and you can even compare two slots, before and after your optimization for example. Last not least: the setup takes less than 5 minutes — then you can start profiling. And you can profile applications in production as well! I am convinced.
